The stronger-than-expected showing by Democrats in the midterm elections has crystallized concerns about the pace of data center construction. What can’t be controlled by political fiat, however, is the underlying demand for AI compute, which continues to grow unabated. This demand is reflected in the cost to rent an Nvidia GPU:
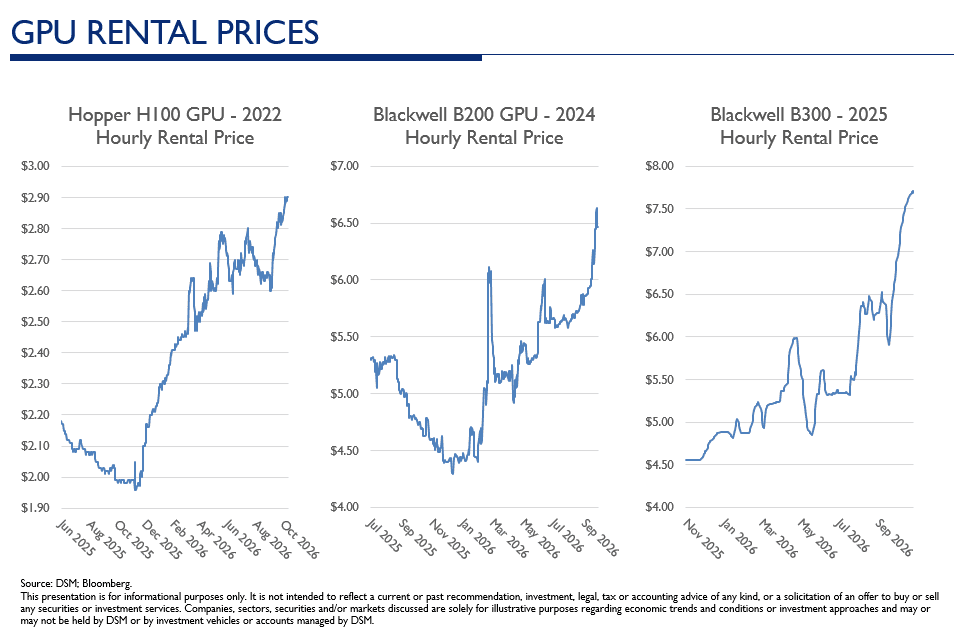
GPU rental prices in these ranges equate to an annual price of ~$20 per watt of data center capacity for multiyear contracts. For shorter-term agreements (less than a year), prices are much higher, at ~$40 per watt, reflecting the near-term scarcity of compute as end users ramp up their usage and labs explore new research directions. For context, it costs ~$60 per watt to build a data center today, and the cost to operate one is minimal (approximately $1 per watt), so the rental revenue is almost pure profit on a cash basis (before depreciation and financing costs).
Nobody knows how long the current pricing environment will last—demand is overwhelming right now, but a lot of capacity is going to come online in the next three to five years. As a result, buyers will commit to the $40-per-watt level only for terms of less than one year: they know they need that capacity right now to meet customer demand, but they might be able to get it for less in the future. For data center owners, five years at $20 per watt is still great: they get a three-year cash payback and an unlevered IRR of 20%, before accounting for the residual value of the GPUs at that point or the use of leverage to boost equity returns. Owners are therefore happy to lock in the $20-per-watt rate for a multiyear period.
In a sense, the $40-per-watt short-term rates that some neoclouds have cited, or the $50-per-watt short-term rates that SpaceX received earlier this year for two high-profile GPU leases, are almost too good—the data center pays for itself in one to one-and-a-half years! So, of course, everyone is going berserk trying to throw together data centers as fast as humanly possible (e.g., SpaceX’s claim that it will go from 3 GW at the end of this year to 13 GW at the end of 2027). It’s practically a no-risk trade: just get this super-high rate for a year or two, and then you have a fully paid-for asset; you almost don’t care what you rent it for in years two through five! In that scenario, a massive amount of capacity will be added in 2027 because the economics are so strong—and if demand starts to slacken at any point, the market will end up with a lot of capacity that lacks long-term contracts, held by owners who are happy to take whatever short-term rate they can get. This could lead to increased cyclicality in data center construction, which would hurt the predictability and profitability of the industry’s suppliers.
To be clear, we don’t think demand is going to slacken. Historically, it has been very difficult to predict the long-term markets for transformational technologies: the total addressable market (TAM) for the written word was far smaller before the printing press, and the TAM for local transport was far smaller before the internal combustion engine. The impact and adoption of disruptive technologies have always been underestimated. But in the event that demand does slow, you can see why data center opponents might almost be doing the industry a favor by restricting its growth: if everyone has to build a little more slowly, the result is a longer tail of higher prices and, despite a slightly lower growth rate, greater profits.
Important Legal Information
This material is provided for informational purposes only. It is not intended to reflect a current or past specific recommendation, investment, legal, tax or accounting advice of any kind, or an offer or solicitation of an offer to buy or sell any securities or investment services in any jurisdiction where or to any person to whom it would be unauthorized or unlawful to do so. Except as otherwise specified, any companies, sectors, securities and/or markets discussed are solely for illustrative purposes regarding economic trends and conditions or investment process and may or may not be held by DSM Capital Partners LLC (“DSM”) or other investment vehicles or accounts managed by DSM.
Price, EPS, and price-to-earnings ratio information discussed herein is provided only to illustrate market trends, and is not intended to represent the performance of any investment vehicle or account managed by DSM, nor any portion of any such investment vehicle or account. The information provided herein is current as of the date of issuance (or such other date as referenced herein) and is subject to change without notice.
This information should not be construed as research or investment advice. Returns are historical and past performance is no guarantee of future results and individual accounts and results will vary. The value of investments and the income derived from investments can go down as well as up. Investing entails risks, including possible loss of principal. Future returns are not guaranteed. There is also special risk considerations associated with international and global investing (especially emerging markets), small and mid-capitalization companies, or other growth and/or concentrated investment strategies. Investors are urged to consult with their financial advisors before buying or selling any securities.
This information may not be current, and DSM has no obligation to provide any updates or changes. Although the information has been obtained from sources believed to be reliable, there are no guarantees of accuracy, completeness or fairness. DSM has relied upon and assumed without independent verification the accuracy and completeness of some of the information. Opinions expressed are current opinions as of the date written. No part of this material may, without DSM’s prior written consent, be (i) copied, photocopied or duplicated in any form, by any means, or (ii) distributed to any person that is not an employee, officer, director, or authorized agent of the recipient.
Certain statements herein are based on current expectations, estimates, projections, opinions and/or beliefs constituting “forward-looking statements,” which can be identified by the use of forward-looking terminology such as “may,” “expect,” “anticipate,” “project,” “estimate,” “intend,” “target,” or “believe” or similar terminology. No representation or warranty is made with respect to such statements and future events may differ materially from those contemplated herein. Projected earnings growth is shown for informational purposes only and is based on various assumptions, including historical performance for similar investments and/or current market conditions. Risks and uncertainties mean the actual growth could differ materially from the projected earnings growth. There is no guarantee that the projected earnings growth will occur. Projected earnings growth is theoretical and does not represent actual trading or the impact of economic or market factors and is not a projection of the return on any investment or of any client account.
Earnings per share, price to earnings ratios and other valuation metrics/ratios do not guarantee investment success. DSM may not be successful in predicting EPS growth or P/E ratio and other ratios/metrics, and as a result, client portfolios may fail to meet investment objectives and investors may experience losses. Investment outcomes may be materially worse than presented herein. The price-to-earnings ratio is an equity valuation metric defined as market price per share divided by annual earnings per share. It can be simplified as the ratio of total market capital value over earnings. Earnings per share is a company’s total earnings or net income divided by its shares outstanding. Earnings per share can be found by taking the net income and dividing it by the basic or diluted number of shares outstanding.
Certain information contained herein is based on DSM proprietary models. The use of models and/or tools does not guarantee investment success. Models/tools apply statistical methods and a series of fixed assumptions to derive estimates of asset class performance. Reasonable people may disagree about the appropriate assumptions. Models/tools also have limitations. For instance, assumptions may not be consensus views, or the models/tools may not be updated to reflect current economic, market or political conditions. Models/tools should not be relied upon to make predictions of actual future performance. DSM has no obligation to provide updates or changes to such data. DSM projections are not guarantees of future results and there is no representation that these securities were, would have been or will be profitable. Performance-based criteria was not used to compile the contribution to return lists. The holdings were selected over the measurement period shown in a mechanical and objective manner by using a calculation to show their relative impact on overall performance; they were not included or excluded for any other reason. The holdings identified my not represent all of the securities purchased, sold, or recommended. The calculation computes the contribution of each holding by calculating the weight (i.e., percentage of the total account) invested in each holding multiplied by the rate of return for that holding during the measurement period. The result shows each holding’s contribution to the overall return during the measurement period. A complete list of all recommendations made by DSM is available upon request.
