During the first quarter of 2026, investors worried that AI would erode the competitive moats of established software companies, that hyperscaler spending was unsustainable, and that valuations were stretched. The uncertainty about AI and the corresponding rotation out of tech stocks during the latter half of 2025 and the first quarter of 2026 had a material impact on relative valuations.
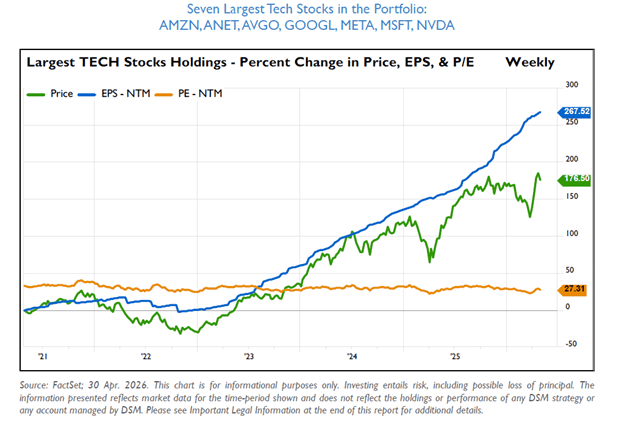
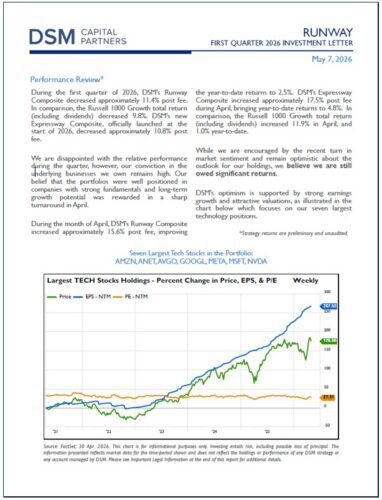
Despite the market’s disappointing first quarter returns for several foundational technology companies, earnings continued to move higher. These companies’ stock prices had moved sideways and down since last summer despite the persistent drive upward of earnings. As discussed in our latest Runway Investment Letter, “the ‘gap’ between the blue and green (see figure below) represents the significant returns we believe we are ‘owed.’”
We heard the concerns surrounding AI disruption but disagreed with much of that narrative. The companies we own are not passive bystanders to AI disruption — they are active participants and beneficiaries. We believe these businesses are net AI beneficiaries that are currently being valued as net losers.
Investors are selling software companies due to AI fears which we believe are largely exaggerated. Businesses that offer industry-specific solutions and companies embedded in the way people conduct business continue to benefit from substantial data, compliance capabilities, customer relationships, and decades of expertise. We believe the continued advancements of AI models and new use cases grow their total addressable markets and enhance their growth trajectories.
At the same time, investors are also lightening up on shares of companies investing heavily to support the AI buildout. Alphabet, Amazon.com, and Meta Platforms all described how larger scale investments are the direct result of higher than anticipated demand. Management teams continue to generate substantial revenue and ROI from these investments while repeatedly stating that demand for their products will continue to exceed supply in the short to medium-term.
We believe AI will continue to drive durable earnings growth and investors will return to buy these names as their earnings power grinds higher. Their growth opportunities remain intact.
Important Legal Information
This material is provided for informational purposes only. It is not intended to reflect a current or past specific recommendation, investment, legal, tax or accounting advice of any kind, or an offer or solicitation of an offer to buy or sell any securities or investment services in any jurisdiction where or to any person to whom it would be unauthorized or unlawful to do so. Except as otherwise specified, any companies, sectors, securities and/or markets discussed are solely for illustrative purposes regarding economic trends and conditions or investment process and may or may not be held by DSM Capital Partners LLC (“DSM”) or other investment vehicles or accounts managed by DSM.
Price, EPS, and price-to-earnings ratio information discussed herein is provided only to illustrate market trends, and is not intended to represent the performance of any investment vehicle or account managed by DSM, nor any portion of any such investment vehicle or account. The information provided herein is current as of the date of issuance (or such other date as referenced herein) and is subject to change without notice.
This information should not be construed as research or investment advice. Returns are historical and past performance is no guarantee of future results and individual accounts and results will vary. The value of investments and the income derived from investments can go down as well as up. Investing entails risks, including possible loss of principal. Future returns are not guaranteed. There is also special risk considerations associated with international and global investing (especially emerging markets), small and mid-capitalization companies, or other growth and/or concentrated investment strategies. Investors are urged to consult with their financial advisors before buying or selling any securities.
This information may not be current, and DSM has no obligation to provide any updates or changes. Although the information has been obtained from sources believed to be reliable, there are no guarantees of accuracy, completeness or fairness. DSM has relied upon and assumed without independent verification the accuracy and completeness of some of the information. Opinions expressed are current opinions as of the date written. No part of this material may, without DSM’s prior written consent, be (i) copied, photocopied or duplicated in any form, by any means, or (ii) distributed to any person that is not an employee, officer, director, or authorized agent of the recipient.
Certain statements herein are based on current expectations, estimates, projections, opinions and/or beliefs constituting “forward-looking statements,” which can be identified by the use of forward-looking terminology such as “may,” “expect,” “anticipate,” “project,” “estimate,” “intend,” “target,” or “believe” or similar terminology. No representation or warranty is made with respect to such statements and future events may differ materially from those contemplated herein. Projected earnings growth is shown for informational purposes only and is based on various assumptions, including historical performance for similar investments and/or current market conditions. Risks and uncertainties mean the actual growth could differ materially from the projected earnings growth. There is no guarantee that the projected earnings growth will occur. Projected earnings growth is theoretical and does not represent actual trading or the impact of economic or market factors and is not a projection of the return on any investment or of any client account.
Earnings per share, price to earnings ratios and other valuation metrics/ratios do not guarantee investment success. DSM may not be successful in predicting EPS growth or P/E ratio and other ratios/metrics, and as a result, client portfolios may fail to meet investment objectives and investors may experience losses. Investment outcomes may be materially worse than presented herein. The price-to-earnings ratio is an equity valuation metric defined as market price per share divided by annual earnings per share. It can be simplified as the ratio of total market capital value over earnings. Earnings per share is a company’s total earnings or net income divided by its shares outstanding. Earnings per share can be found by taking the net income and dividing it by the basic or diluted number of shares outstanding.